

Malaysia External Trade Statistics revealed that the trade Performance for August 2023 (And The Period Of January – August 2023) recorded a 40th consecutive month of trade Surplus registering a year-on-year (y-o-y) growth of 0.1% to RM17.31 billion.
The Ministry of Investment, Trade And Industry (MITI), in a statement today (Sept 19) said trade decreased by 19.8% to RM213.01 billion amid slower global demand and lower commodity prices.
Exports was lower by 18.6% to RM115.16 billion and imports edged down by 21.2% to RM97.85 billion. The performance was similar to Malaysia’s key trading partners notably the Republic of Korea (ROK), China, Taiwan and Indonesia which recorded negative trade growth for August 2023 and drop in their global imports.
Compared to July 2023, trade, exports, imports and trade surplus contracted by 1.5%, 1.4%, 1.6% and 0.3%, respectively.
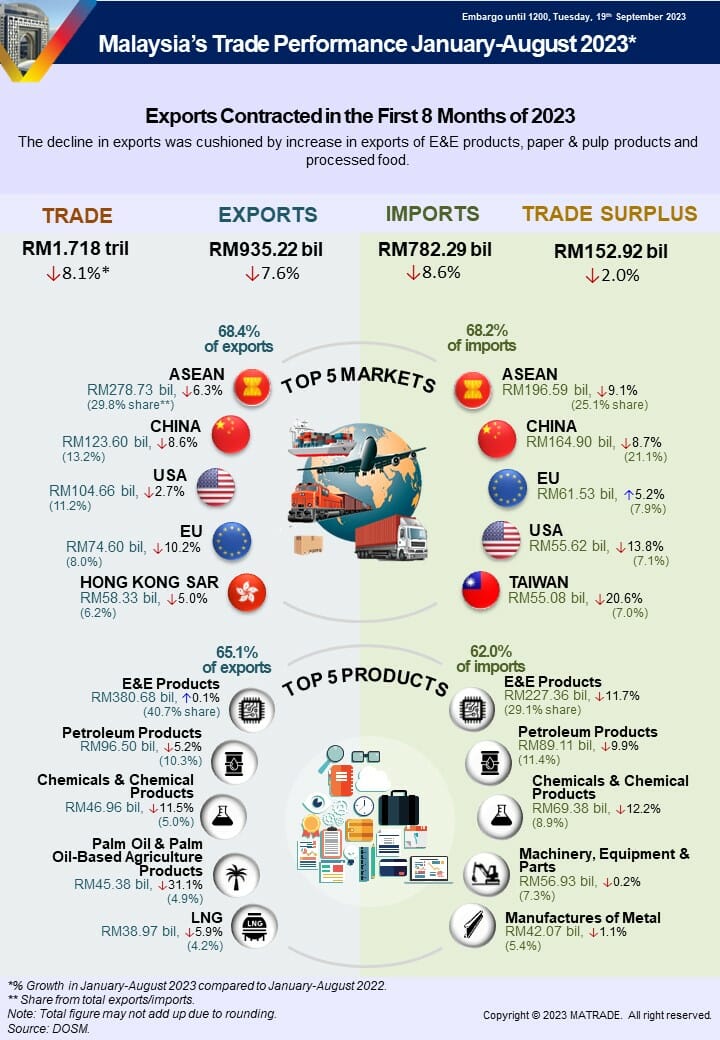
For the period of January to August 2023, trade reduced by 8.1% to RM1.718 trillion compared to the same period of last year. Exports shrank by 7.6% to RM935.22 billion, imports slipped by 8.6% to RM782.29 billion and trade surplus fell by 2% to RM152.92 billion, respectively.

Export Performance of Major Sectors
Manufactured Goods Contributed 85.4% to Total Exports
In August 2023, exports of manufactured goods which accounted for 85.4% or RM98.36 billion of total exports dropped by 17.7% y-o-y following reduced demand for electrical and electronic (E&E) products, petroleum products as well as palm oil-based manufactured products. Meanwhile, export growth was registered for paper and pulp products as well as processed food.
Exports of mining goods (7.3% share) was lower by 23.1% y-o-y to RM8.46 billion due to reduced exports of liquefied natural gas (LNG) and crude petroleum.
Exports of agriculture goods (6.6% share) decreased by 27.1% to RM7.61 billion compared to August 2022 owing to slower exports of palm oil and palm oil-based agriculture products that was affected significantly by weaker export prices of palm oil.
Major exports in August 2023:
• E&E products, valued at RM43.38 billion and accounted for 37.7% of total exports, decreased by 15.3% compared to August 2022;
• Petroleum products, RM12.44 billion, 10.8% of total exports, ↓38.6%; • Chemicals and chemical products, RM5.99 billion, 5.2% of total exports, ↓10%; • Palm oil and palm oil-based agriculture products, RM5.56 billion, 4.8% of total exports, ↓31.9%; and
• Machinery, equipment and parts, RM5.06 billion, 4.4% of total exports, ↓9.9%.
On a month-on-month (m-o-m) basis, exports of mining and agriculture goods rose by 15.3% and 0.7%, respectively while exports of manufactured goods edged down by 3%.
For the period of January to August 2023, exports of manufactured goods contracted by 5.9% to RM800.62 billion compared to the same period of 2022 following decreased exports of palm oil-based manufactured products, manufactures of metal and rubber products. However, strong exports of paper and pulp products, processed food as well as E&E products cushioned the impact of the decline.
Exports of mining goods slipped by 9.1% to RM68.27 billion on lower shipments of crude petroleum, LNG as well as petroleum condensates and other petroleum oil.
Exports of agriculture goods fell by 25.8% to RM60.81 billion, due to slower exports of palm oil and palm oil-based agriculture products following decrease in export prices of palm oil.
Trade Performance with Major Markets
ASEAN Comprised 27.9% of Total Trade
In August 2023, trade with ASEAN comprised 27.9% or RM59.46 billion of Malaysia’s total trade, dropped by 16.3% y-o-y. Exports weakened by 20.6% to RM33.48 billion as a result of reduced exports of petroleum products and E&E products. Meanwhile, higher exports was recorded for machinery, equipment and parts as well as LNG. Imports from ASEAN eased by 9.9% to RM25.98 billion.
Breakdown of exports to ASEAN countries:
• Singapore RM16.81 billion, decreased by 19.3%;
• Thailand RM4.53 billion, ↓22.3%;
• Viet Nam RM4.35 billion, ↑23.4%;
• Indonesia RM4.00 billion, ↓40.3%;
• Philippines RM2.98 billion, ↑12.6%;
• Brunei RM426.0 million, ↓46.0%;
• Myanmar RM204.8 million, ↓85.3%;
• Cambodia RM168.0 million, ↓59.9%; and
• Lao PDR RM17.0 million, ↓66.6%.
Exports to ASEAN major markets that recorded double-digit growth was Viet Nam which grew by RM825.7 million and the Philippines, increased by RM333.8 million supported by strong exports of petroleum products, respectively.
Compared to July 2023, trade, exports and imports decreased by 2.3%, 3.2% and 1.1%, respectively.
For the period of January to August 2023, trade with ASEAN was lower by 7.5% to RM475.32 billion compared to the corresponding period of 2022. Exports edged down by 6.3% to RM278.73 billion due to slower shipment of chemicals and chemical products, petroleum products as well as palm oil and palm oil-based agriculture products. The contraction however was softened by higher exports of non-metallic mineral products as well as jewellery. Imports from ASEAN contracted by 9.1% to RM196.59 billion.
China – Trade Was Lower in August 2023
In August 2023, trade with China which absorbed 16.7% or RM35.65 billion of Malaysia’s total trade reduced by 18.7% y-o-y. Exports to China fell by 20.3% to RM14.72 billion on lower exports of E&E products and LNG. Nonetheless, export growth was posted for paper and pulp products as well as petroleum products. Imports from China shrank by 17.5% to RM20.94 billion.
Compared to July 2023, imports expanded by 2.8% while trade and exports were down by 4.1% and 12.4%, respectively.
Trade with China during the first eight months of 2023 slipped by 8.7% to RM288.51 billion compared to the same period of 2022. Exports fell by 8.6% to RM123.6 billion on account of decreased exports of iron and steel products, E&E products as well as palm oil and palm oil-based agriculture products. Despite the contraction, higher exports were posted for paper and pulp products as well as metalliferous ores and metal scrap.
Imports from China dropped by 8.7% to RM164.9 billion.
The US – Absorbed 9.7% of Total Exports
Trade with the United States (US) in August 2023 which constituted 9.7% of Malaysia’s total trade weakened by 15.7% y-o-y to RM20.68 billion. Exports reduced by 9.7% to RM13.52 billion following lower demand for E&E products and petroleum products.
However, expansion in exports was recorded for iron and steel products as well as chemicals and chemical products. Imports from the US eased by 25.1% to RM7.16 billion.
On a m-o-m basis, trade, exports and imports dipped by 2.7%, 0.5% and 6.7%, respectively.
For the period of January to August 2023, trade with the US decreased by 6.8% to RM160.29 billion compared to the same period of 2022. Exports was lower by 2.7% to RM104.66 billion attributed to reduced exports of wood products, rubber products as well as iron and steel products. On the contrary, expansion in exports was registered mainly for E&E products. Imports from the US edged down by 13.8% to RM55.62 billion.
The EU – Exports of E&E Products Remained Steady
In August 2023, trade with the European Union (EU) contributed 8.2% to Malaysia’s total trade, grew by 0.6% y-o-y to RM17.49 billion. Exports reduced by 4.6% to RM9.57 billion underpinned by lower shipment of petroleum products, palm oil and palm oil-based agriculture products as well as machinery, equipment and parts. Meanwhile, export growth was registered for E&E products as well as iron and steel products. Imports from the EU increased by 7.7% to RM7.92 billion.
Breakdown of exports to the top 10 EU markets which accounted for 92.1% of Malaysia’s total exports to the region were:
• Netherlands RM3.22 billion, increased by 5.7%;
• Germany RM2.48 billion, ↓1.9%;
• Belgium RM807.7 million, ↑4.0%;
• Italy RM596.6 million, ↓4.7%;
• Spain RM529.4 million, ↑50.9%;
• France RM520.4 million, ↓34.7%;
• Poland RM223.3 million, ↓37.5%;
• Czech Republic RM192.9 million, ↓41.1%;
• Hungary RM130.6 million, ↓32.6%; and Exports to the EU major markets that recorded growth were the Netherlands, which increased by RM172.5 million due to strong exports of E&E products, Belgium (↑RM30.9 million, iron and steel products) and Spain (↑RM178.6 million, palm oil-based manufactured products).
Compared to July 2023, trade, exports and imports grew by 3.9%, 6.4% and 1.1%, respectively.
In January to August 2023, trade with the EU slipped by 3.8% to RM136.12 billion compared to the same period of 2022. Exports decreased by 10.2% to RM74.6 billion owing to lower exports of palm oil and palm oil-based products as well as rubber products while higher demand was seen for optical and scientific equipment, processed food as well as paper and pulp products. Imports from the EU was up by 5.2% to RM61.53 billion.
Japan – Trade and Exports Grew M-o-M
In August 2023, trade with Japan which made up 5.9% or RM12.62 billion of Malaysia’s total trade fell by 25.7% y-o-y. Exports dropped by 19.3% to RM7.43 billion following lower shipment of LNG, petroleum products as well as E&E products. However, the decline was offset by strong exports of crude petroleum as well as manufactures of metal. Imports from Japan weakened by 33.2% to RM5.19 billion.
On a m-o-m basis, trade and exports rose by 11.4% and 28.1%, respectively while imports contracted by 6.2%.
For the first eight months of 2023, trade with Japan dipped by 12% to RM104.04 billion compared to the corresponding period of 2022. Exports decreased by 10.1% to RM56.93 billion on slower exports of LNG as well as petroleum products. Conversely, higher demand was recorded for crude petroleum and optical and scientific equipment. Imports from Japan was lower by 14.2% to RM47.11 billion.
Trade with FTA Partners
In August 2023, trade with Free Trade Agreement (FTA) partners which took up 67.5% or RM143.71 billion of Malaysia’s total trade edged down by 17.7% y-o-y. Exports to FTA partners contracted by 18.6% to RM79.47 billion and imports reduced by 16.6% to RM64.24 billion.
In term of markets, increases in exports were recorded to Australia which expanded by 12.6% to RM4.29 billion boosted by solid exports of petroleum products. Additionally, exports to Turkiye rose by 24.1% to RM1.83 billion bolstered by higher exports of iron and steel products.
Compared to July 2023, imports climbed by 0.1% while trade and exports shrank by 1.7% and 3.1%, respectively.
Trade with FTA partners during the first eight months of 2023 slipped by 7.8% to RM1.162 trillion compared to the same period of last year. Exports fell by 5.9% to RM654.89 billion and imports dropped by 10.1% to RM507.31 billion.
Import Performance
Total imports in August 2023 were lower by 21.2% y-o-y to RM97.85 billion. The three main categories of imports by end use, which accounted for 72.3% of total imports were:
• Intermediate goods, valued at RM51.45 billion or 52.6% of total imports, decreased by 22.6% y-o-y, following lower imports of processed fuel and lubricants;
• Capital goods, valued at RM10.71 billion or 10.9% of total imports, expanded by 5.4%, due to higher imports of non-transport capital goods; and
• Consumption goods, valued at RM8.53 billion or 8.7% of total imports, contracted by 5.4%, driven by lower imports of non-durables.
During the period of January to August 2023, imports edged down by 8.6% to RM782.29 billion compared to the corresponding period of 2022. Imports of intermediate goods contracted by 15.6% to RM399.42 billion compared to the same period last year, capital goods (↑1.2% to RM78.17 billion) and consumption goods (↓1.3% to RM67.02 billion).


