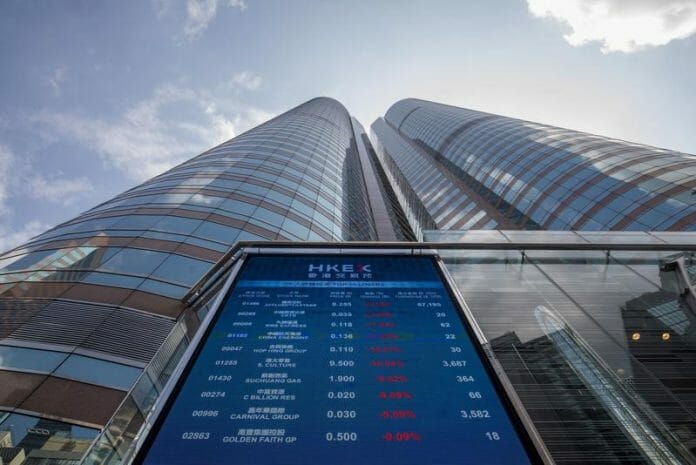
Hang Seng Index Futures: Hitting The Wall Of Immediate Resistance
The HSIF’s upside movement was blocked by the immediate resistance yesterday, as it retraced 89 pts to settle the day session at 20,486 pts. The index initially opened at 20,499 points and, after moving in between 20,619 points and 20,298 points, it closed marginally below the opening price. During the evening session, as it tracked the weak performance of its US peers, the HSIF pulled back 386 pts and last traded at 20,100 points.
The price action showed that the 20,694-point resistance remains intact while the index has slipped below the 20-day SMA line. If it continues to trade below this moving average line, the HSIF may retrace towards the 19,063-point support.
In the event the index breaches above the immediate resistance, RHB said that it will climb towards the higher resistance pegged at 21,216 points. Since the RSI has fallen below the 50% threshold, we think the momentum is now getting weaker.
As such, RHB said that it keeps to our negative bias adding that it advise traders to hold on to the short positions initiated at 21,129 points or the close of 11 Apr.
To mitigate the trading risks, the stop-loss threshold is set at 21,216 points. The immediate support stays at 19,063 pts – 10 May’s low – and is followed by 18,134 points, ie the low of 16 Mar. The immediate resistance is seen at 20,694 points – 6 May’s high – and followed by the higher hurdle at 21,216 pts, which was the high of 5 May.
Comex Gold Consolidating Sideways Above The Support
The COMEX Gold retreated USD3.00 yesterday and settled lower at USD1,822.40. The commodity started off the session at USD1,820.20, RHB Research said.
It said that after moving in-between a tight range of USD1,829.30 and USD1,811.70, it closed at USD1,822.40. Despite printing a bullish candlestick yesterday, the latest session’s high of USD1,829.30 is lower than the high of the previous session, ie USD1,834.80.
A “lower high” indicates the bullish momentum is softening, and the COMEX Gold will resort to sideways movements. If it breaches below the USD1,800 support, the commodity may retrace towards the lower support at USD1,780.
So far, the COMEX Gold has been trading below the 20-day SMA line – it has yet to chart a fresh “higher high” pattern. Hence, the bearish structure remains intact, and we continue to hold on to a negative trading bias.
Traders should retain the short positions initiated at USD1,934.30 or the closing level of 22 Apr. To minimise the trading risks, the trailing-stop threshold is fixed at USD1,912. The immediate support is kept at USD1,800 with a lower one marked at USD1,780. Conversely, the immediate resistance is pegged at USD1,860 with a higher resistance seen at USD1,890.
E-Mini Dow: Falling Sharply Towards 31,000 Pts
The E-Mini Dow reversed its recent rebound yesterday after falling sharply by 1,141 points to settle at 31,440 points – negating a rebound that has been going on since last Friday.
The index initially began positively at 32,629 points to hit the 32,651-point day high. Selling interest then emerged to drag it lower throughout this period, with the E-Mini Dow hitting the 31,299-point day low before the close.
RHB Research said that the latest long black candlestick showed the bears were back in control to steer the index southwards – eyeing to hit the 31,148-point immediate support before reaching the next threshold at 30,500 points.
As the E-Mini Dow is forming a “lower high” bearish structure way below the 50-day average line, the downtrend movement remains intact. This is also supported by the weakening RSI at the 35% level. Unless the momentum reverses, we retain our bearish bias.
Traders are advised to keep to the short positions initiated at 33,728 points or the closing level of 22 Apr. To manage the trading risks, the stop-loss threshold is set at 34,038 points. The immediate support is marked at 31,148 points, ie the low of 12 May. This is followed by the 30,500-point round figure. The nearest resistance is eyed at 32,692 points – 17 May’s high – and followed by 34,038 points or 26 Apr’s high.
WTI Crude : Profit-Taking Continues Below The USD110.00 Threshold
After failing to sustain its intraday bullish momentum yesterday, the WTI Crude reversed direction southwards – plunging USD2.81 to settle at USD109.59 and breaching below the USD110.00 support turned resistance.
RHB said that It started stronger at USD113.66 and then touched the USD115.42 high before selling pressure kicked in. The negative sentiment then drove the commodity lower as it fell sharply towards the USD108.46 session low.
It said that the bearish candlestick printed for two consecutive sessions – following the recent peak – suggests the WTI Crude will trend downwards below the USD110.00 threshold towards the USD100.00 psychological support in the immediate term. We think strong buying interest will be seen at the USD100.00 support – resulting in a medium-term rebound.
Looking at the medium-term outlook, we maintain our long positions – unless the stop-loss mark is breached. We recommend traders retain the long positions initiated at USD110.49 or the close of 10 May.
RHB said that to manage the trading risks, the initial stop-loss threshold is set at USD100.00. The immediate support is marked at the USD100.00 round figure. The lower support is placed at USD93.53 or 15 Mar’s low. On the upside, the first resistance is seen at USD110.00 and then followed by the higher resistance of USD116.64, which was high of 24 Mar


